Temperature-dependent sRNA transcriptome of the Lyme disease spirochete
B. burgdorferi, the causative agent of Lyme disease, is an enzootic pathogen that cycles
between a tick vector and a mammalian host. The spirochete must adapt to and survive
within these two disparate environments, which requires the appropriate regulation of gene expression.
Temperature is one of the key environmental cues that signal the transition from the tick vector to the mammalian host.
Like many other pathogenic bacteria, B. burgdorferi regulates gene expression at the transcriptional level.
However, little is known about post-transcriptional gene regulation in B. burgdorferi despite its emergence
as a major player in gene regulation.
Small non-coding regulatory RNAs (sRNAs) regulate gene expression via a variety of different mechanisms, including
translation inhibition and stimulation via base pairing to target mRNAs. This website presents data describing the small RNA
transcriptome of B. burgdorferi at two culture temperatures that mimic different stages of the enzootic cycle.
We identified over 1000 sRNAs of which 43% are potentially temperature-dependent, suggesting they play a role in adaptation to these two temperatures. The sRNAs were found in intergenic regions, 5' UTRs of genes, antisense to and encoded within annotated genes (asRNA and intraRNA respectively). Northern blot analyses of twenty-two sRNAs validated the RNA-seq data. This study is the first genome-wide identification of regulatory RNAs in this important pathogen and reveals a large sRNA network.
Data access
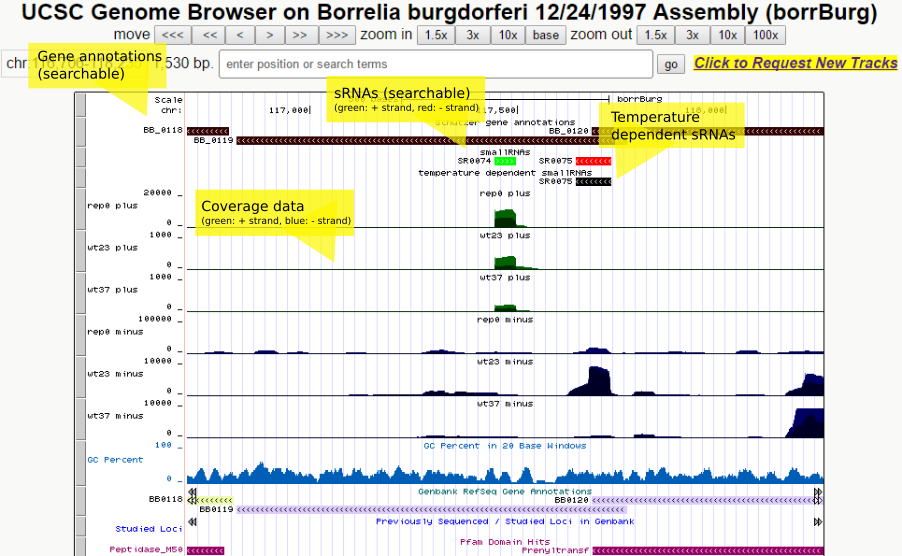
You can directly access the sequence data and the called small RNAs in the following
UCSC browser track hub:
All called sRNAs are additionally contained in the following table:
You can also
download this table as a filterable EXCEL sheet
Download
The following data tracks can be downloaded for visualization in a genome browser (e.g., IGV). Please note that the BigWig tracks contain normalized coverage signals useful for visual inspection of the data. The actual algorithms that we used for the detection of (temperature-dependent) sRNAs (peak calling and differential expression analysis) were run on the unnormalized data as they use their own normalization methods (see below and paper).
- rep0-wt23-minus (UCSC)UCSC: BigWig files using UCSC's replicon identifiers (plasmid identifiers are prefixed by "plasmid_", e.g., "plasmid_lp54"). (IGV/BigWig)IGV/BigWig: BigWig files using default replicon identifiers (e.g., "lp54"). (IGV/TDF)IGV/TDF: TDF files using default replicon identifiers. This file format is supported by IGV and the files 5-7X smaller than the BigWig files.
- rep0-wt23-plus (UCSC)UCSC: BigWig files using UCSC's replicon identifiers (plasmid identifiers are prefixed by "plasmid_", e.g., "plasmid_lp54"). (IGV/BigWig)IGV/BigWig: BigWig files using default replicon identifiers (e.g., "lp54"). (IGV/TDF)IGV/TDF: TDF files using default replicon identifiers. This file format is supported by IGV and the files 5-7X smaller than the BigWig files.
- rep0-wt37-minus (UCSC)UCSC: BigWig files using UCSC's replicon identifiers (plasmid identifiers are prefixed by "plasmid_", e.g., "plasmid_lp54"). (IGV/BigWig)IGV/BigWig: BigWig files using default replicon identifiers (e.g., "lp54"). (IGV/TDF)IGV/TDF: TDF files using default replicon identifiers. This file format is supported by IGV and the files 5-7X smaller than the BigWig files.
- rep0-wt37-plus (UCSC)UCSC: BigWig files using UCSC's replicon identifiers (plasmid identifiers are prefixed by "plasmid_", e.g., "plasmid_lp54"). (IGV/BigWig)IGV/BigWig: BigWig files using default replicon identifiers (e.g., "lp54"). (IGV/TDF)IGV/TDF: TDF files using default replicon identifiers. This file format is supported by IGV and the files 5-7X smaller than the BigWig files.
- rep1-wt23-minus (UCSC)UCSC: BigWig files using UCSC's replicon identifiers (plasmid identifiers are prefixed by "plasmid_", e.g., "plasmid_lp54"). (IGV/BigWig)IGV/BigWig: BigWig files using default replicon identifiers (e.g., "lp54"). (IGV/TDF)IGV/TDF: TDF files using default replicon identifiers. This file format is supported by IGV and the files 5-7X smaller than the BigWig files.
- rep1-wt23-plus (UCSC)UCSC: BigWig files using UCSC's replicon identifiers (plasmid identifiers are prefixed by "plasmid_", e.g., "plasmid_lp54"). (IGV/BigWig)IGV/BigWig: BigWig files using default replicon identifiers (e.g., "lp54"). (IGV/TDF)IGV/TDF: TDF files using default replicon identifiers. This file format is supported by IGV and the files 5-7X smaller than the BigWig files.
- rep1-wt37-minus (UCSC)UCSC: BigWig files using UCSC's replicon identifiers (plasmid identifiers are prefixed by "plasmid_", e.g., "plasmid_lp54"). (IGV/BigWig)IGV/BigWig: BigWig files using default replicon identifiers (e.g., "lp54"). (IGV/TDF)IGV/TDF: TDF files using default replicon identifiers. This file format is supported by IGV and the files 5-7X smaller than the BigWig files.
- rep1-wt37-plus (UCSC)UCSC: BigWig files using UCSC's replicon identifiers (plasmid identifiers are prefixed by "plasmid_", e.g., "plasmid_lp54"). (IGV/BigWig)IGV/BigWig: BigWig files using default replicon identifiers (e.g., "lp54"). (IGV/TDF)IGV/TDF: TDF files using default replicon identifiers. This file format is supported by IGV and the files 5-7X smaller than the BigWig files.
- rep2-wt23-minus (UCSC)UCSC: BigWig files using UCSC's replicon identifiers (plasmid identifiers are prefixed by "plasmid_", e.g., "plasmid_lp54"). (IGV/BigWig)IGV/BigWig: BigWig files using default replicon identifiers (e.g., "lp54"). (IGV/TDF)IGV/TDF: TDF files using default replicon identifiers. This file format is supported by IGV and the files 5-7X smaller than the BigWig files.
- rep2-wt23-plus (UCSC)UCSC: BigWig files using UCSC's replicon identifiers (plasmid identifiers are prefixed by "plasmid_", e.g., "plasmid_lp54"). (IGV/BigWig)IGV/BigWig: BigWig files using default replicon identifiers (e.g., "lp54"). (IGV/TDF)IGV/TDF: TDF files using default replicon identifiers. This file format is supported by IGV and the files 5-7X smaller than the BigWig files.
- rep2-wt37-minus (UCSC)UCSC: BigWig files using UCSC's replicon identifiers (plasmid identifiers are prefixed by "plasmid_", e.g., "plasmid_lp54"). (IGV/BigWig)IGV/BigWig: BigWig files using default replicon identifiers (e.g., "lp54"). (IGV/TDF)IGV/TDF: TDF files using default replicon identifiers. This file format is supported by IGV and the files 5-7X smaller than the BigWig files.
- rep2-wt37-plus (UCSC)UCSC: BigWig files using UCSC's replicon identifiers (plasmid identifiers are prefixed by "plasmid_", e.g., "plasmid_lp54"). (IGV/BigWig)IGV/BigWig: BigWig files using default replicon identifiers (e.g., "lp54"). (IGV/TDF)IGV/TDF: TDF files using default replicon identifiers. This file format is supported by IGV and the files 5-7X smaller than the BigWig files.
- sRNA BED (UCSC BED)UCSC BED: BED files using UCSC's replicon identifiers (plasmid identifiers are prefixed by "plasmid_", e.g., "plasmid_lp54"). Temperature regulated sRNAs have the score set to 1000. (IGV BED)IGV BED: BED files using default replicon identifiers (e.g., "lp54"). Temperature regulated sRNAs have the score set to 1000.
- B31 reference sequence (IGV FASTA)IGV FASTA: Reference sequence using default replicon identifiers (e.g., "lp54"). (IGV FAI)IGV FAI: FASTA index.
Please also note that the raw sequence data have been deposited at the National Center for Biotechnology Information Sequence Read Archive (Study accession number SRP078488; experiment accession numbers SRX1948239 and SRX1948242).
Data Creation
Three independent biological replicates were sequenced on an Illumina HiSeq2000 (single-end, read length: 50bp) to different genomic coverages. The high-coverage replicate (rep0) was used for the identification of B. burgdorferi sRNAs, the two low-coverage replicates (rep1, rep2) were used to identify sRNAs that are differentially expressed at the two probed temperatures.
All data was sequenced on an Illumina Hiseq2000. Reads are 50bp single-end.
Sequencing adapters were removed from the data using cutadapt v1.2.1.
The resulting reads were mapped to the B. burgdorferi B31 genome
(GenBank Ids: AE000783, AE001583, AE000793, AE001582, AE000785, AE000794, AE000786, AE000784, AE000789, AE000788, AE000787, AE000790, AE001584,
AE000791, AE000792, AE001575, AE001576, AE001577, AE001578, AE001579, AE001580, and AE001581) using
NextGenMap v 0.4.5 with default parameters
and minimum identity set to 90%. Finally, multi-mapped reads were removed and strand-specific coverage data was extracted using
bedtools v2.25.
We developed a simple peak-calling algorithm for identifying potential sRNA peaks in these coverage signals. Briefly, the
strand-specific coverage signal is read and smoothed using a moving Gaussian kernel. Then, peaks are called with a wavelet-transform based
approach that uses a simple mirrored sawtooth kernel for the detection of potential peak boundaries.
Peaks were called only if they complied to predefined minimum/maximum dimensions (peak width: 45-500bp, minimum peak height: 500 reads).
Additionally, peaks were filtered based on their shape as we expected sRNA-derived peaks to present a sharp rise at the 5'-end and an overall "boxy"
shape (i.e., a minimum height/width ratio). In this manner, peaks were called in both deep data
sets (rep0, 23C and 37C) and corresponding genomic intervals were merged between data sets and between intervals if they overlapped more than 80%.
The resulting list of 5,600 genomic candidate intervals (sRNAs) was then subjected to differential expression (DE) analysis. We extracted count tables
for these intervals from the two low-coverage replicates (rep1, rep2) and calculated DE with
edgeR and
DEseq.
5 intervals could not be tested due to too-low coverage in (one of) the replicates. Results were then filtered by adjusted P-value <= 0.05 (P-values
were adjusted using Benjamini and Hochberg's algorithm to control the false discovery rate).
For further analyses we continued with only the edgeR data. We do, however, provide the adjusted DEseq P-values in the final result table for completeness (hidden EXCEL column).
DEseq was more conservative in calling sRNAs significantly DE (173 of 401 sRNAs (43%) that were found to be significantly DE by edgeR were also called significantly DE by DEseq).
Finally, all genomic intervals were manually assessed and curated by multiple members of our research group by visual inspection of the normalized
coverage data and the DE results in the IGV genome browser.
Besides obvious false positive calls and likely degradation products, we also removed all peaks associated with annotated open reading
frames that were 600 nucleotides or shorter from the list of sRNAs.
To validate the accuracy of our 5' end peak-calling method on a genome-wide scale we analyzed the nucleotide composition around all
identified 5' ends. We calculated averaged nucleotide fractions in genomic windows centered at the most 5' positions of identified
sRNAs and plotted the results for all 1,005 sRNAs but also per subcategory (AS, IG, Intra, 5' UTR) and strand-specific in the following PDFs:
PDF of nucleotide context, 100nt up-/downstream of 5' ends;
Zoomed-in version showing the context 50nt downstream to 5nt upstream.
Overall, these plots show an adenine and thymine (A and T) rich sequence at the -10 region correlating to the Pribnow box and an
enrichment in thymine exactly 35 nucleotides upstream of the putative TSS across all novel sRNA categories described in this paper (AS, IG, Intra, 5' UTR),
suggesting indeed these 5' ends are accurate (the -35 T-peak being slightly less prominent for intra-RNAs).
Moreover, we didn't detect these sequence elements associated with the annotated group of sRNAs,
which are primarily tRNAs. tRNAs are processed from primary transcripts to their active and stable form and should not have a Pribnow box at the -10 region.
Citation
Please cite the following paper if you make use of these data:
Popitsch, N.; Bilusic, I.; Rescheneder, P.; Schroeder, R. & Lybecker, M. Temperature-dependent sRNA transcriptome of the Lyme disease spirochete BMC Genomics, 2017, 18, 28. DOI: 10.1186/s12864-016-3398-3
Contact
For further questions about the study and data, please contact Meghan Lybecker and Niko Popitsch.Last updated: 11 Oct2016